
As a nurse, you will at some point see patients with cardiac conditions. Early in my career, this type of patient scared me. I wasn’t knowledgeable on cardiac rhythms. When a patient needed a 12-lead ECG, my anxiety rose. I didn’t know what to look for. Luckily, I was working at a large hospital that offered ECG classes to anyone willing to take them. Even though I worked on a neuro unit, I signed up to take the ECG classes to try to reduce my anxiety. I learned a lot but now realize there were a few key things I needed to know. Abnormalities in the ECG can be life-threatening. Understanding the basics of this common diagnostic test is a nursing priority.

The Electrocardiogarm
I’ll start with some fundamental information. The electrocardiogram (ECG) shows us the function of the electrical system of the heart. The electrical pattern of the heart results in the heart rhythm. In brief, the electrical impulse of the heart begins in the sinoatrial (SA) node. It is in the upper right side of the heart. The cells of the SA node spontaneously change their electrical charge or polarity. Sodium moves into the cells and potassium rushes out. The electrical charge changes and this change is spread from cell to cell. We call the change in the electrical charge an impulse. The impulse travels through the atria and to the atrioventricular junction (AV junction). Then it moves down into the ventricles. Once electrical activation spreads, the muscle contraction occurs. The muscle’s action propels blood forward. All of this activity occurs in a fraction of a second.
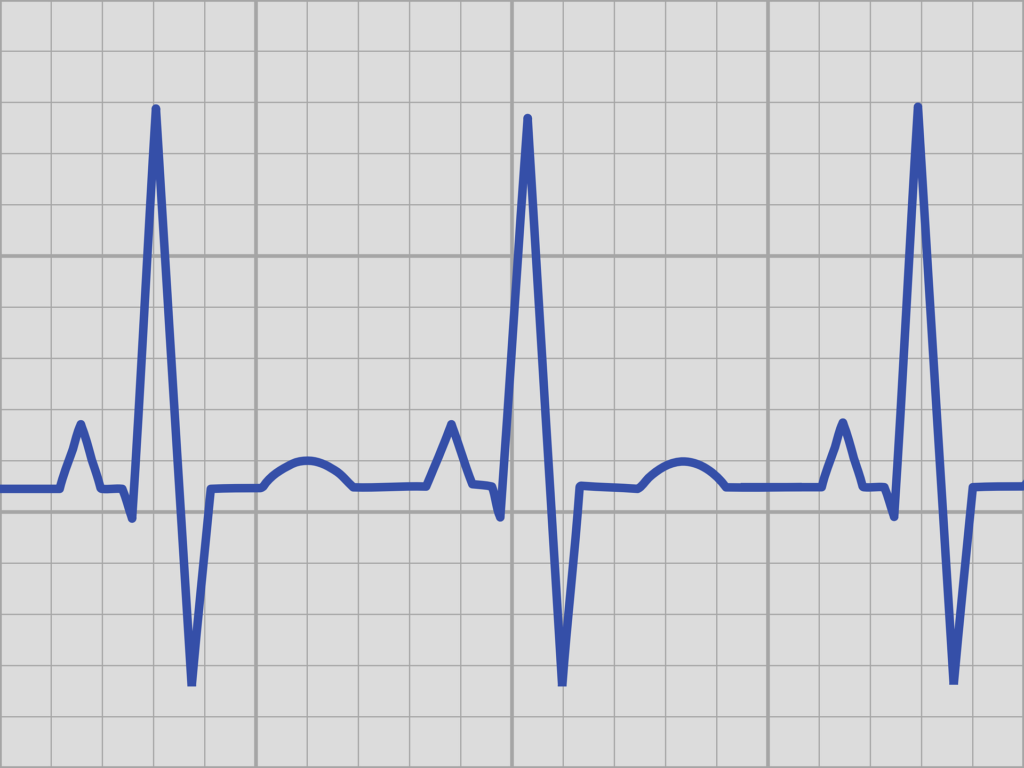
The tracing or pattern on a heart monitor or printed by the ECG equipment shows predictable changes in the pattern. The changes or waves occur with each beat. These changes are labeled P, Q, R, S, and T waves. As the impulse travels through the atria, we see a P wave. There is a slight pause and then a large QRS as the ventricles depolarize. The heart muscle then returns to its resting stage, or repolarizes, creating the T wave. We measure intervals called the PR interval, QRS interval, and QT interval.
The causes of alterations include structural changes like infarction, heart failure, or enlargement of the heart. Trauma or hypoxia (ischemia) can lead to irregular heart rates. Electrolyte abnormalities also affect the heart’s ability to pump effectively. At times, the electrical cells function abnormally and we may not know why. The aging of the cells may play a role. Atrial fibrillation and atrial flutter are examples of arrhythmias sometimes having no exact cause. Almost any changes in the heart could lead to cardiac rhythm.
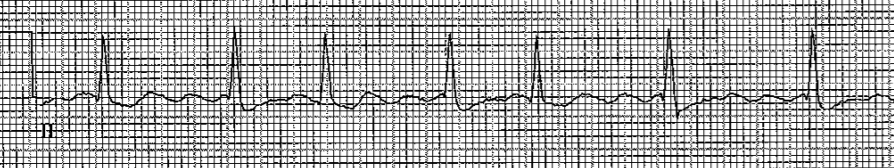
The ECG will tell us if electrical function of the heart is altered. It will also reflect changes in the heart muscle. Some of the changes could be heart rates too slow or too fast. We may see irregular beats or frequent premature beats. Severe life-threatening issues could be ventricular tachycardia, ventricular fibrillation, or asystole (cardiac standstill).
The 12-Lead ECG
A 12-lead ECG gives us a look at 12 different surfaces of the heart. I like to think of it as 12 pictures of the heart. Compare these 12 heart rhythm tracings to 12 pictures of an object. For example, if you wanted to buy a car, you would want to see pictures of the front, sides, back, and roof of the vehicle. The 12-lead ECG is giving you similar pictures with each one called a “lead.” The diagram below shows which of the leads depict the anterior (green), inferior (blue), and lateral (side) (red) aspects of the heart.
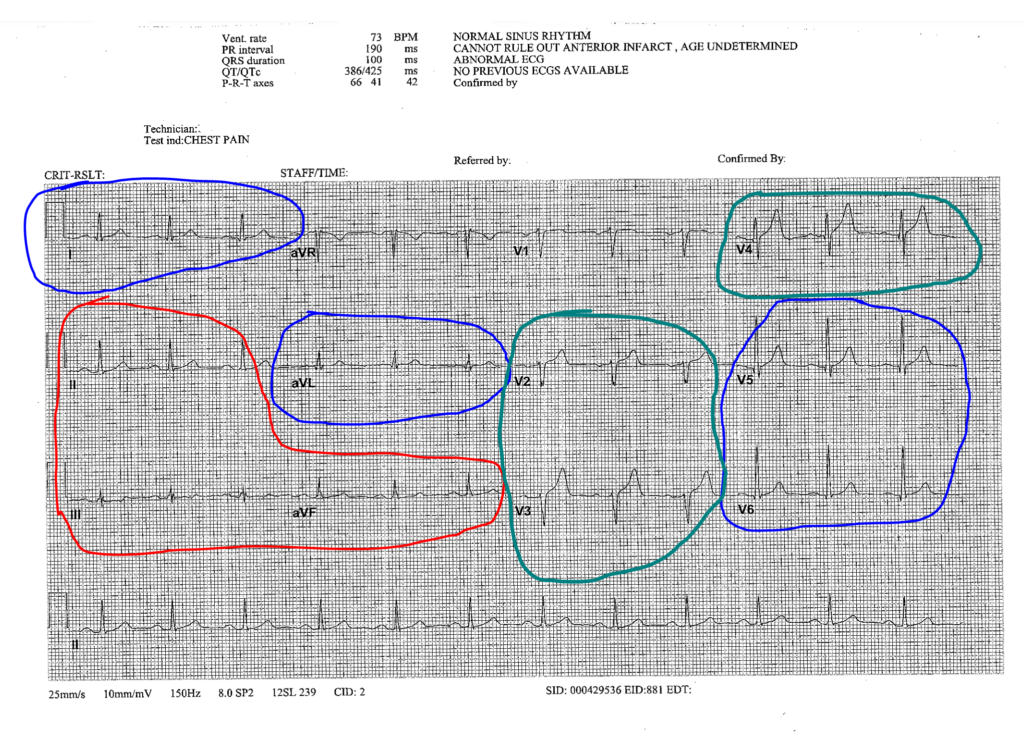
In general, the 12-lead ECG will provide an interpretation of the rhythm, rate, and measurements of each beat. A review of the interpretation helps to determine if life-threatening issues exist. What is the rate? For an adult, the rate should be 60-100 beats/minute. Is the rate too fast or slow? Check the rhythm. The rhythm from beat to beat should be regular. If irregular, an interpretation is provided, such as atrial fibrillation. Premature beats will be identified on the ECG. Changes in the electrical pattern caused by ischemia or infarction will also be identified. They include ST wave elevation, depression, or T wave inversion.
Priority Actions
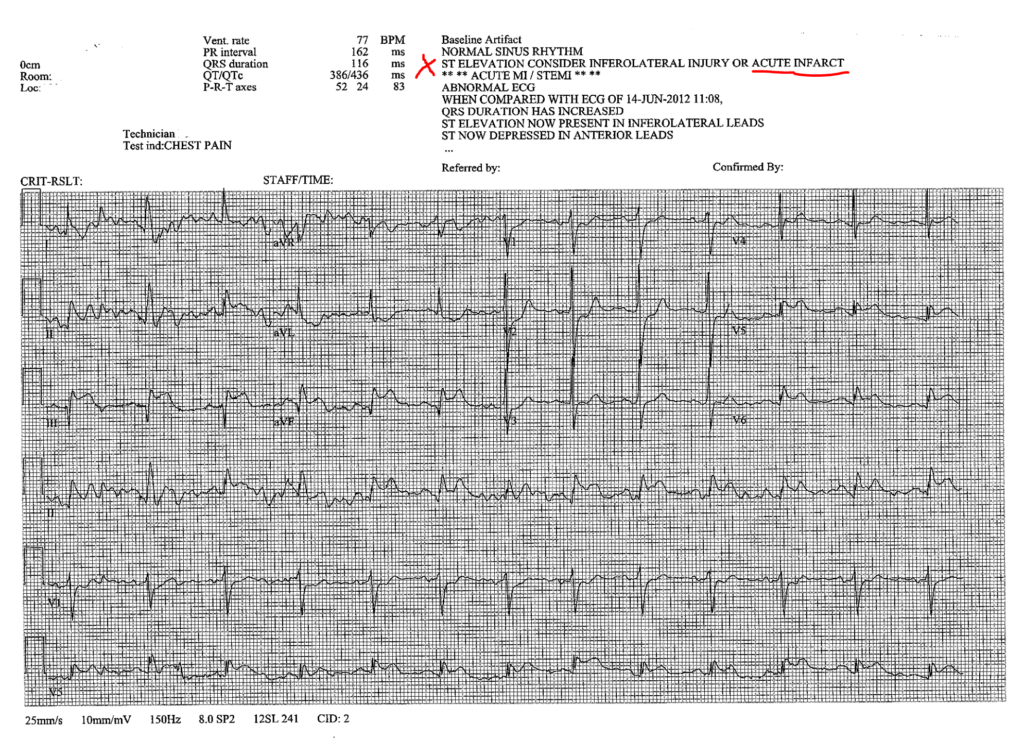
The good news is the 12-lead ECG’s interpretation is on the printout. It will capitalize a life-threatening problem or arrhythmia. So, if you look at the report and it says MYOCARDIAL INFARCTION or ACUTE INFARCT (see below), take it seriously. Immediately check on your patient and notify the provider. Follow your agency’s policy for the care of a patient with myocardial infarction. Actions include taking vital signs, administering oxygen, and considering nitroglycerin administration. If the rate or rhythm is otherwise abnormal, assess your patient first. Then, notify the provider.
Remember that the most important data for you to correlate with the ECG is your patient’s response. Your assessment is a priority. ECG changes often cause signs and symptoms in the patient. On the other hand, a patient could have a fairly normal ECG but be cool, clammy, and hypotensive.
As I write this post, I realize much of this information is review. However, there is to much learn about ECG’s and the 12-lead ECG. Even years after my initial ECG course, I am learning new details. Of course, not everyone needs to know all the details of the test. But, knowing a few details about what may be seen and what to report is important.
Resources:
Here is a nice open educational resource for the heart and conduction system.
Reference:
Anatomy & Physiology. Provided by: OpenStax CNX. Located at: http://cnx.org/contents/14fb4ad7-39a1-4eee-ab6e-3ef2482e3e22@8.25. License: CC BY: Attribution. License Terms: Download for free at http://cnx.org/contents/14fb4ad7-39a1-4eee-ab6e-3ef2482e3e22@8.25